Mission: It's Your Turn!
1. 본문에서 언급된 Featurn를 제외하고 유의미한 Feature를 1개 이상 찾아봅시다.
Hint: Fare? Sibsp? Parch?
# 라이브러리 불러오기

import numpy as np
import pandas as pd
import matplotlib.pyplot as plt
import seaborn as sns

%matplotlib inline

# 데이터 불러오기

titanic_df = pd.read_csv("./train.csv")
titanic_df
PassengerId
Survived
Pclass
Name
Sex
Age
SibSp
Parch
Ticket
Fare
Cabin
Embarked
0
1
0
3
Braund, Mr. Owen Harris
male
22.0
1
0
A/5 21171
7.2500
NaN
S
1
2
1
1
Cumings, Mrs. John Bradley (Florence Briggs Th...
female
38.0
1
0
PC 17599
71.2833
C85
C
2
3
1
3
Heikkinen, Miss. Laina
female
26.0
0
0
STON/O2. 3101282
7.9250
NaN
S
3
4
1
1
Futrelle, Mrs. Jacques Heath (Lily May Peel)
female
35.0
1
0
113803
53.1000
C123
S
4
5
0
3
Allen, Mr. William Henry
male
35.0
0
0
373450
8.0500
NaN
S
...
...
...
...
...
...
...
...
...
...
...
...
...
886
887
0
2
Montvila, Rev. Juozas
male
27.0
0
0
211536
13.0000
NaN
S
887
888
1
1
Graham, Miss. Margaret Edith
female
19.0
0
0
112053
30.0000
B42
S
888
889
0
3
Johnston, Miss. Catherine Helen "Carrie"
female
NaN
1
2
W./C. 6607
23.4500
NaN
S
889
890
1
1
Behr, Mr. Karl Howell
male
26.0
0
0
111369
30.0000
C148
C
890
891
0
3
Dooley, Mr. Patrick
male
32.0
0
0
370376
7.7500
NaN
Q
891 rows × 12 columns
# 여행을 간 사람들중 자신의 배우자와 간 사람들이 얼마나 되는지??또한 배우자와 같이 여행을 갔을때 주로 어떤 클래스를 탑승했는지?
titanic_df['SibSp'].describe()count 891.000000
mean 0.523008
std 1.102743
min 0.000000
25% 0.000000
50% 0.000000
75% 1.000000
max 8.000000
Name: SibSp, dtype: float64# titanic에서 배우자와 같이 간 사람의 수
titanic_df[titanic_df['SibSp'] ==1].count()PassengerId 209
Survived 209
Pclass 209
Name 209
Sex 209
Age 183
SibSp 209
Parch 209
Ticket 209
Fare 209
Cabin 69
Embarked 209
dtype: int64# 배우자랑 같이가면서 평균적으로 어떤 클래스를 탑승 했는지?
titanic_df[titanic_df['SibSp'] ==1].groupby('SibSp').mean()['Pclass']SibSp
1 2.057416
Name: Pclass, dtype: float64titanic_df[titanic_df['SibSp'] ==0].groupby('SibSp').mean()['Pclass']SibSp
0 2.351974
Name: Pclass, dtype: float64sns.heatmap(titanic_df[['Pclass','SibSp']].groupby(['Pclass']).mean())
plt.show()
---------------------------------------------------------------------------

NameError                                 Traceback (most recent call last)

/var/folders/yz/pbmrbcx947s847jw36l2_14r0000gn/T/ipykernel_10433/243699932.py in <module>
----> 1 sns.heatmap(titanic_df[['Pclass','Ddd']].groupby(['Pclass']).mean())
      2 plt.show()

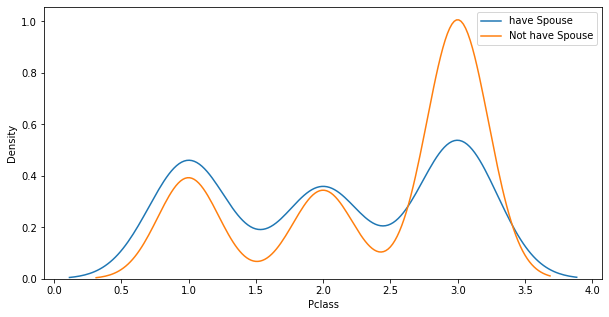
NameError: name 'sns' is not defined## SibSp 1, 0과 Age의 경향성
# figure(어떠한 그래프 도면) -> axis(figure안에 있는 x축 y축 틀) -> plot(그려지는거)
fig,ax = plt.subplots(1,1,figsize = (10,5))
sns.kdeplot(x=titanic_df[titanic_df.SibSp == 1]['Pclass'],ax=ax)
sns.kdeplot(x=titanic_df[titanic_df.SibSp == 0]['Pclass'],ax=ax)
plt.legend(["have Spouse","Not have Spouse"])
plt.show()
2. Kaggle에서 Dataset을 찾고, 이 Dataset에서 유의미한 Feature를 3개이상 찾고 이를 시각화 해봅시다.
df = pd.read_csv("./StudentsPerformance.csv")
# 결측값 확인
df.isnull().count()gender 1000
race/ethnicity 1000
parental level of education 1000
lunch 1000
test preparation course 1000
math score 1000
reading score 1000
writing score 1000
dtype: int64df.head()
gender
race/ethnicity
parental level of education
lunch
test preparation course
math score
reading score
writing score
0
female
group B
bachelor's degree
standard
none
72
72
74
1
female
group C
some college
standard
completed
69
90
88
2
female
group B
master's degree
standard
none
90
95
93
3
male
group A
associate's degree
free/reduced
none
47
57
44
4
male
group C
some college
standard
none
76
78
75
1. 여성 남성별로 과목별 점수 확인하기
남성, 여성별로 어떠한 과목에서 더 우위를 보일까?
df[['math score','reading score','writing score','gender']].groupby(['gender']).mean()

# 전체적으로 여성이 남성보다 읽기와 쓰기를 잘하는걸 볼 수있고 남성은 수학을 더 잘하는것을 볼 수 있다.
math score
reading score
writing score
gender
female
63.633205
72.608108
72.467181
male
68.728216
65.473029
63.311203
2. parental level of education의 따라 성적 분포가 어떻게 될까? 평균값으로 계산
df['parental level of education'].unique()array(["bachelor's degree", 'some college', "master's degree",
"associate's degree", 'high school', 'some high school'],
dtype=object)df[['math score','reading score','writing score','parental level of education']].groupby(['parental level of education']).mean().sort_values(by='math score',ascending = False)
math score
reading score
writing score
parental level of education
master's degree
69.745763
75.372881
75.677966
bachelor's degree
69.389831
73.000000
73.381356
associate's degree
67.882883
70.927928
69.896396
some college
67.128319
69.460177
68.840708
some high school
63.497207
66.938547
64.888268
high school
62.137755
64.704082
62.448980
전체적으로 학위가 올라가면 올라갈수록 성적 분포가 점점 증가하는 경향을 띄고있다.
3. test preparation course 을 한사람과 안한사람들의 시험 평균차이는 얼마나 날까?
df[df['test preparation course'] == "completed"].mean()math score 69.695531
reading score 73.893855
writing score 74.418994
dtype: float64df[df['test preparation course'] == "none"].mean()math score 64.077882
reading score 66.534268
writing score 64.504673
dtype: float64무대뽀로 하기 힘들다면? 다음 Hint와 함께 시도해봅시다:
데이터를 뽑아 봅시다.
각 데이터는 어떤 자료형을 가지고 있나요?
데이터에는 결측치 는 없나요? -> 있다면 이를 어떻게 메꿔줄까요?
데이터의 자료형을 바꿔줄 필요가 있나요? -> 범주형의 One-hot encoding
데이터에 대한 가설을 세워봅시다.
가설은 개인의 경험에 의해서 도출되어도 상관이 없습니다.
가설은 명확할수록 좋습니다 ex) Titanic Data에서 Survival 여부와 성별에는 상관관계가 있다!
가설을 검증하기 위한 증거를 찾아봅시다.
이 증거는 한눈에 보이지 않을 수도 있습니다. 우리가 다룬 여러 Technique를 써줘야합니다.
.groupby()를 통해서 그룹화된 정보에 통계량을 도입하면 어떨까요?.merge()를 통해서 두개 이상의 dataFrame을 합치면 어떨까요?시각화를 통해 일목요연하게 보여주면 더욱 좋겠죠?